Free Multi-Timeframe 20 SMA Indicator
See higher-timeframe 20 SMA levels directly on your chart without switching timeframes.
What this indicator does
- Displays the 20 SMA from multiple higher timeframes on one chart
- Helps identify higher-timeframe bias and trend direction
- Acts as dynamic support and resistance
- Reduces chart clutter and screen switching
- Works on all markets and sessions
Screenshots
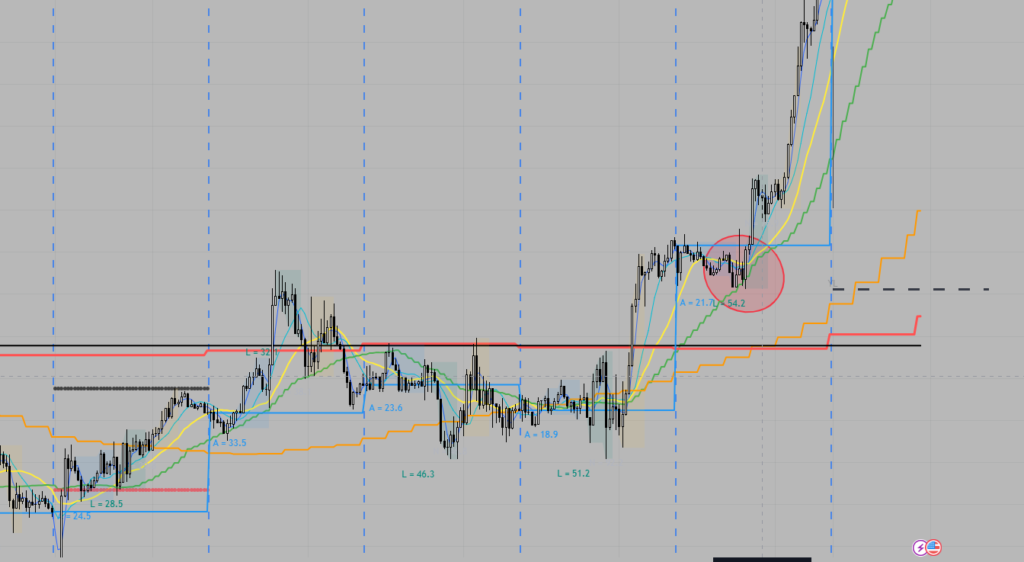
- As you can see, price is coiling and reversing on the 20SMA from multiple timeframes
- Makes it easier for you to see the direction
- This is just a confirmation of your bias. Don’t use the EMA to solely place trades
- In the example above, Friday’s bias was a buy. At the start of the London session, the price was at the Low of the day and also tapping the 20SMA from multiple timeframes
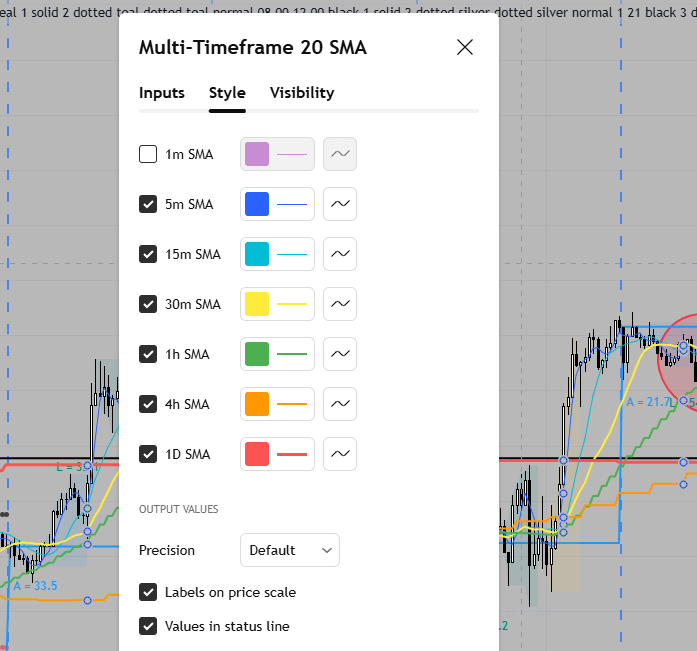
Indicator Settings